
XRP has pulled back from intraday highs amid heavy trading activity and remains above key support levels while lagging broader crypto benchmarks.
news background
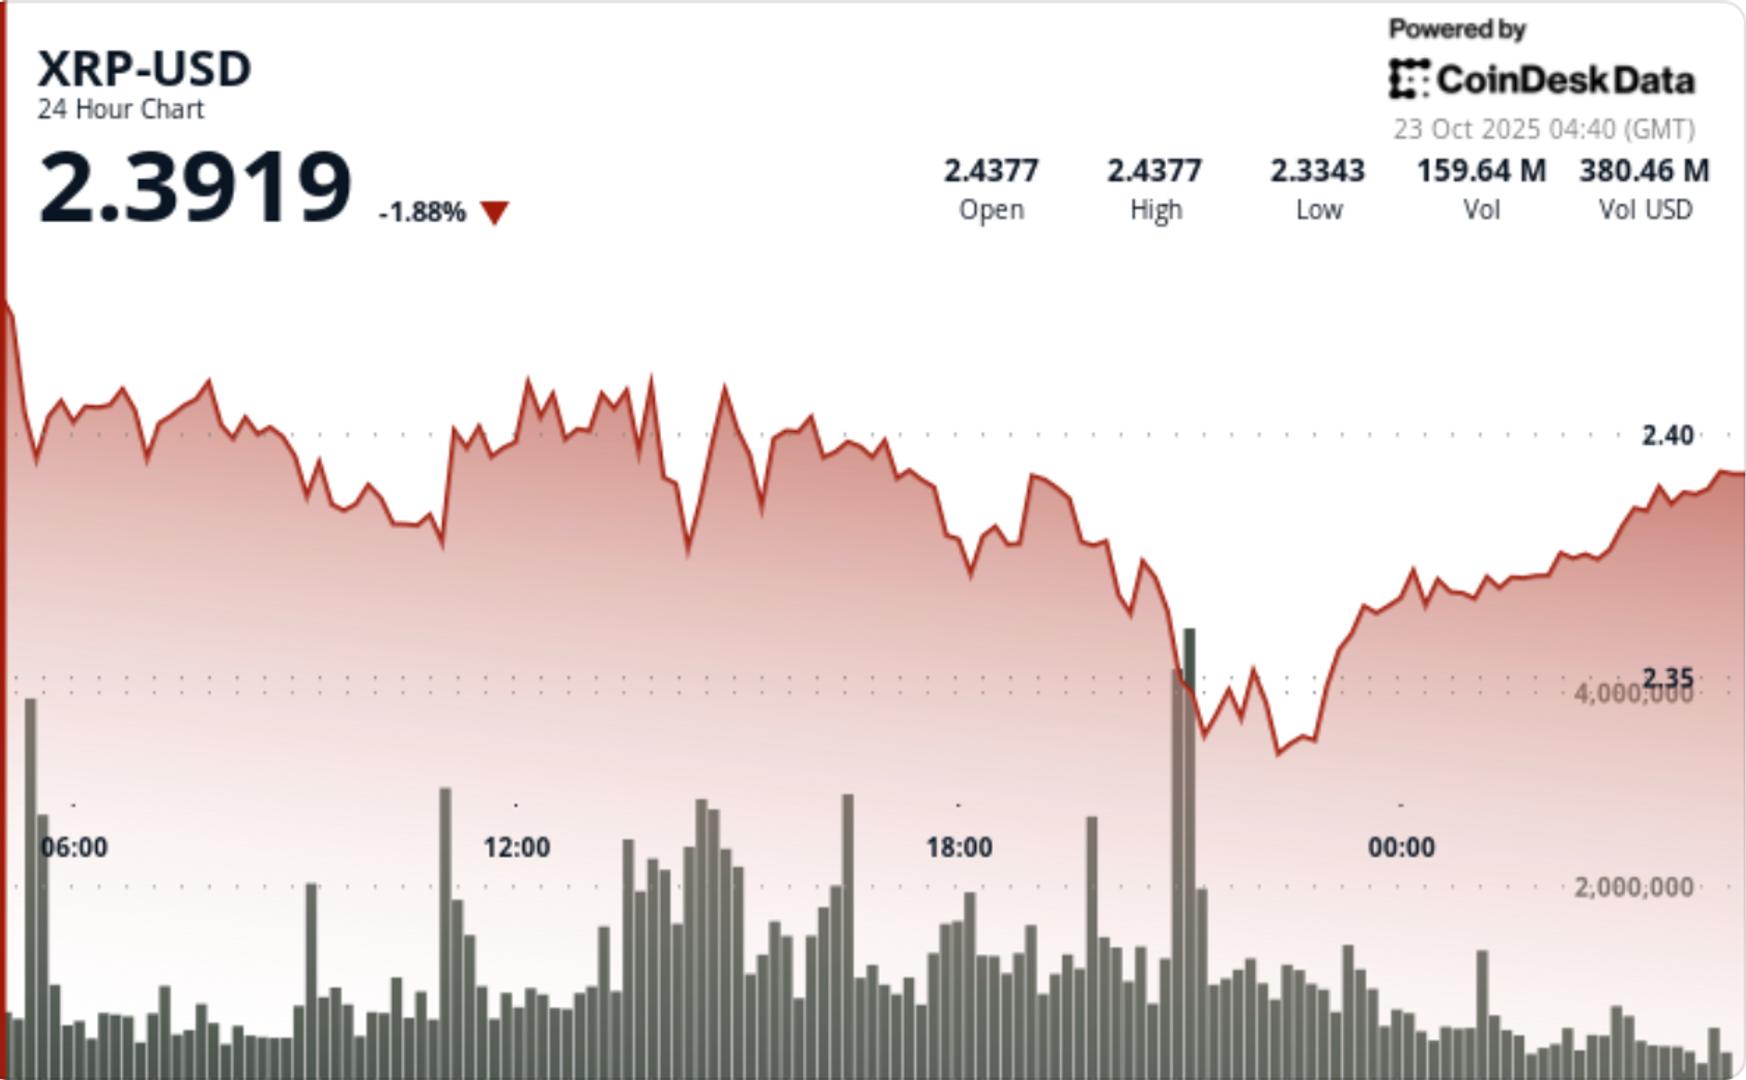
- XRP slipped 1.17% to $2.39 during Tuesday’s session, underperforming the CD5 index by 1.47 percentage points as sellers regained short-term control.
- The move came despite a 5.77% increase in trading activity above the weekly average, indicating a strategic repositioning rather than an outright liquidation.
Price action remained confined within the $2.33-$2.44 corridor, maintaining technical integrity despite changes in market flow. - Traders described the move as “order book churn” – heavy rotation within a defined range – with institutions realigning ahead of the potential catalyst.
price action summary
- XRP fell from $2.44 to $2.39 during Tuesday’s session, forming a descending channel that defines a volatility range of 4.2%.
- The biggest drop occurred around 21:00, when volume surged to 111.3 million – 83% more than the 24-hour average – as bears pushed the price from support at $2.36 to a session low of $2.33.
- Buyers re-emerged around the psychological level of $2.33, leading to a modest surge to $2.39 on light volume. Resistance strengthened near $2.41, with repeated rejections forming a close low-high structure.
- Implied recovery suggests a situation rather than directional conviction, with market makers managing inventory amid low conviction flows.
technical analysis
- XRP’s structure remains range-bound with a descending channel between the resistance at $2.44 and the support at $2.33.
- The token’s inability to break above $2.41 reflects short-term exhaustion, although a persistent defense of $2.33 indicates strong bid depth.
- Momentum indicators hover near neutral levels, and volume remains high enough to maintain interest but below the breakout threshold. Hourly data shows XRP stabilizing above the $2.38 midrange support while maintaining a narrow volatility band – a typical pre-break compression setup.
What are traders looking for?
- Traders are focused on whether the volume re-acceleration confirms continued downward pressure or precedes a moving average reversion push above $2.41.
- A daily close above that resistance could trigger a momentum extension to $2.47-$2.50, while a sustained break below $2.33 risks a return to the $2.28 area.
- Institutional desks are also looking at macro correlations – specifically gold’s reversal lower and Bitcoin’s stable bid – to gauge the dynamics of rotation into risk assets as volatility eases.